IC Markets Home Sign in Web Trader Contact Us
IC Markets Social IC Markets Social

Information Hub for
Serious Traders

  • ABOUT US
  • OPEN LIVE ACCOUNT
  • OPEN DEMO ACCOUNT
  • TRADE NOW
  • VISIT OUR BLOG
IC Markets Social
  • ABOUT US
  • OPEN LIVE ACCOUNT
  • OPEN DEMO ACCOUNT
  • TRADE NOW
  • VISIT OUR BLOG
October 26, 2023Australian_Stocks_enIC Markets

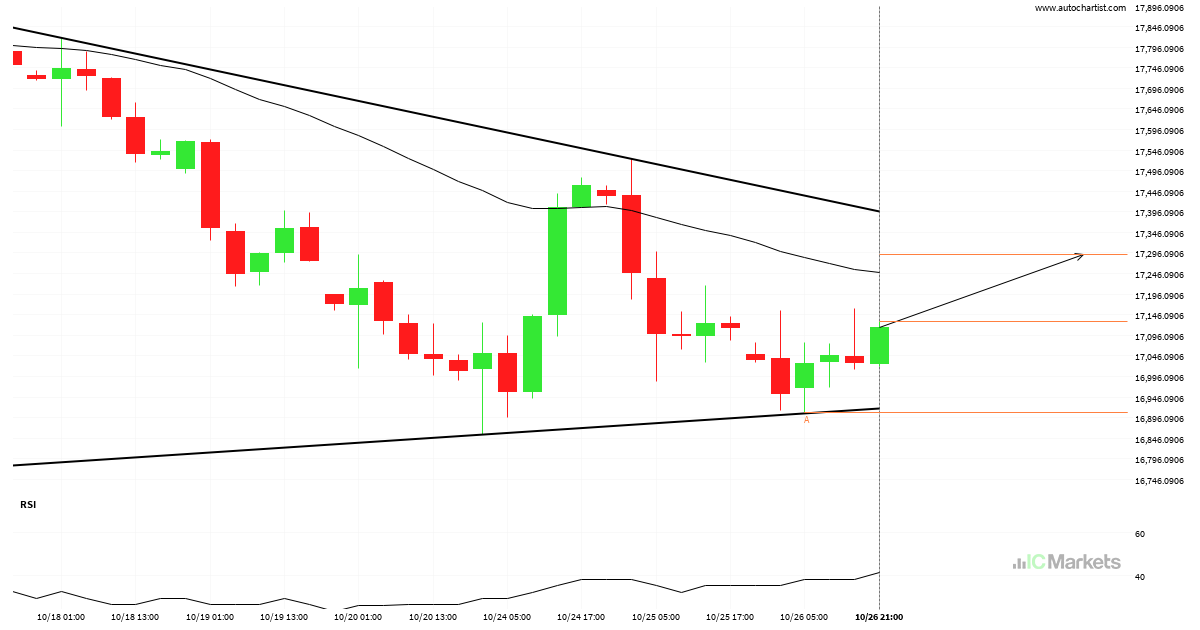
Hong Kong 50 Index approaching resistance of a Triangle

Hong Kong 50 Index is approaching the resistance line of a Triangle. It has touched this line numerous times in the last 14 days. If it tests this line again, it should do so in the next 2 days.

Read more
October 26, 2023Australian_Stocks_enIC Markets

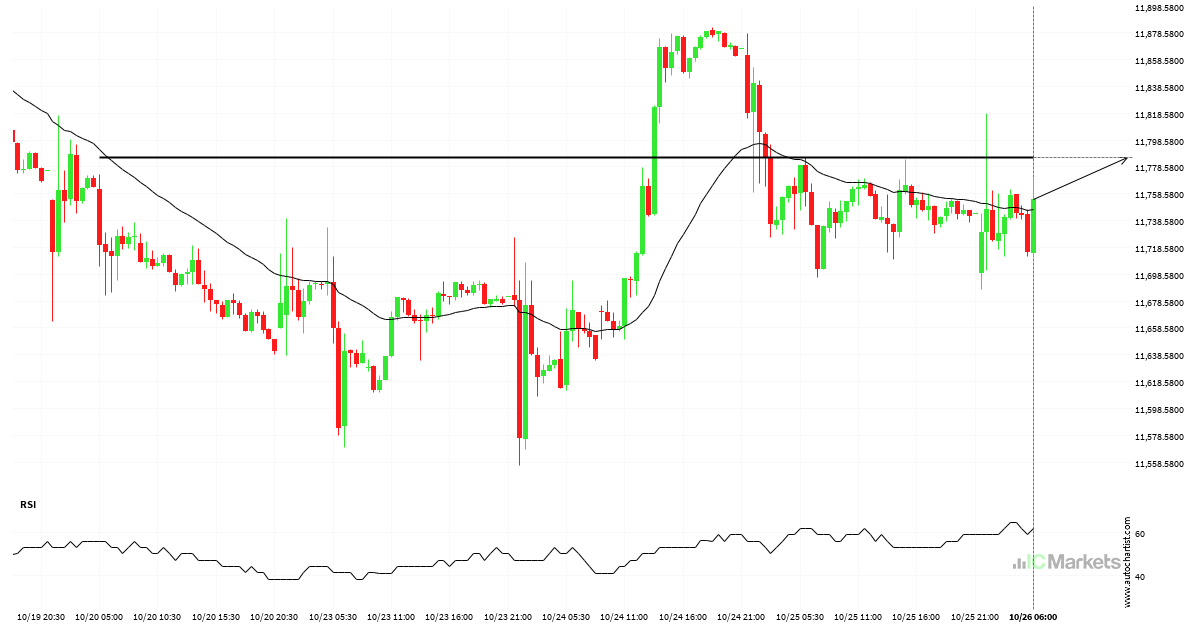
FTSE China A50 Index – getting close to psychological price line

FTSE China A50 Index is moving towards a resistance line. Because we have seen it retrace from this level in the past, we could see either a break through this line, or a rebound back to current levels. It has touched this line numerous times in the last 7 days and may test it again […]

Read more
October 25, 2023Australian_Stocks_enIC Markets

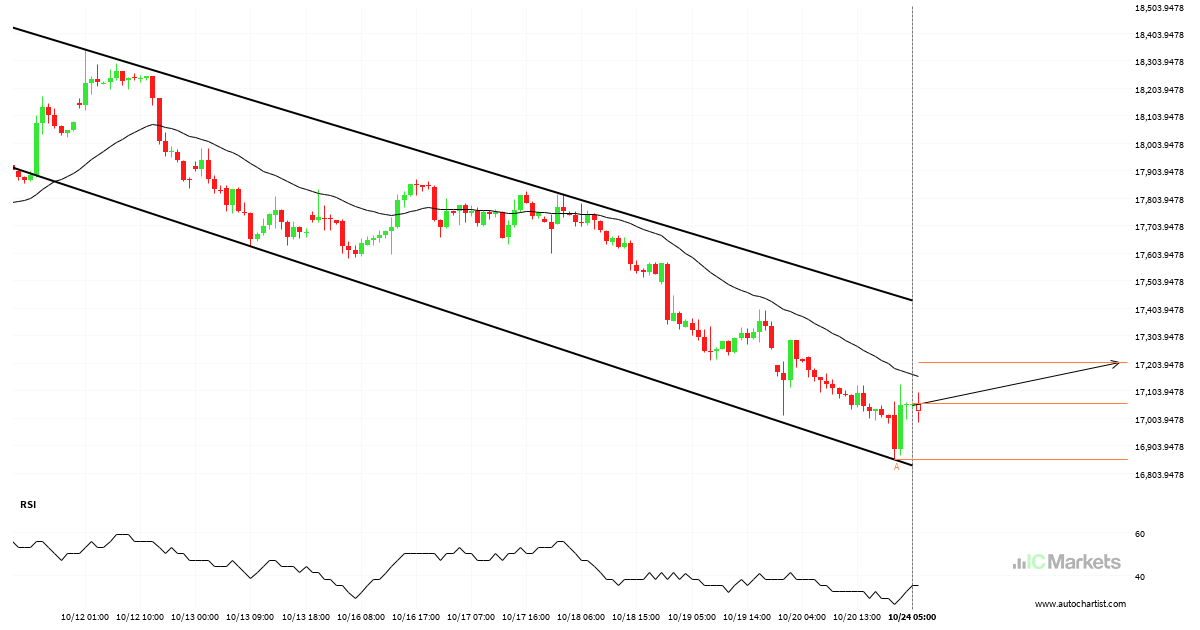
Hong Kong 50 Index approaching support of a Channel Down

Hong Kong 50 Index is approaching the support line of a Channel Down. It has touched this line numerous times in the last 16 days. If it tests this line again, it should do so in the next 3 days.

Read more
October 24, 2023Australian_Stocks_enIC Markets

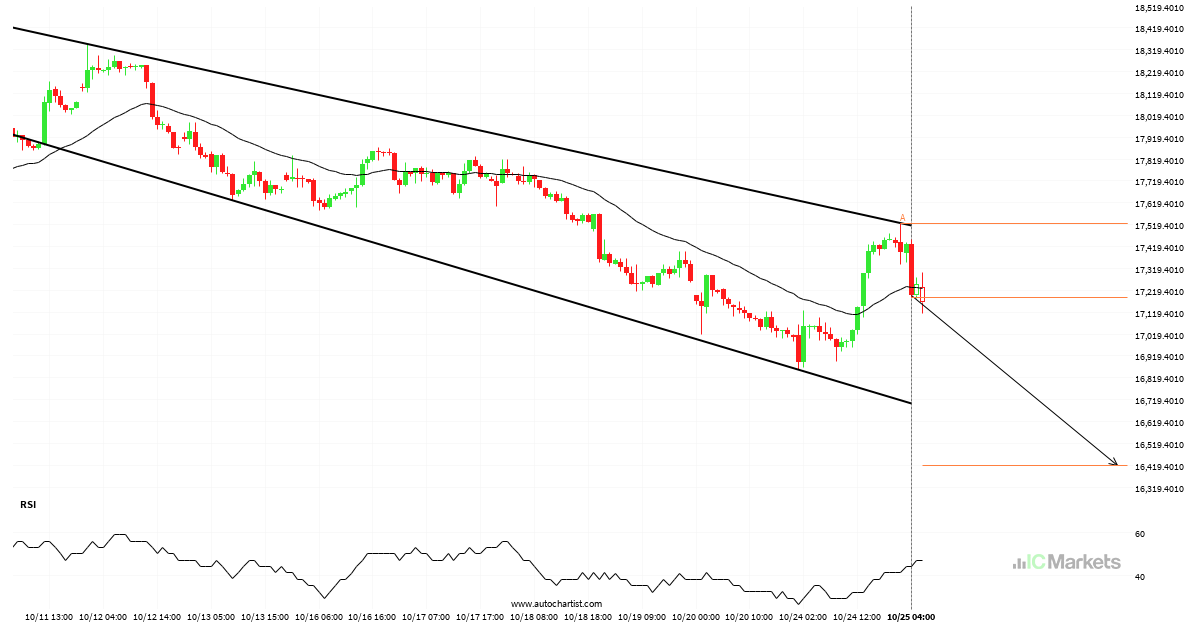
Hong Kong 50 Index approaching resistance of a Channel Down

Hong Kong 50 Index is approaching the resistance line of a Channel Down. It has touched this line numerous times in the last 15 days. If it tests this line again, it should do so in the next 2 days.

Read more
October 23, 2023Australian_Stocks_enIC Markets

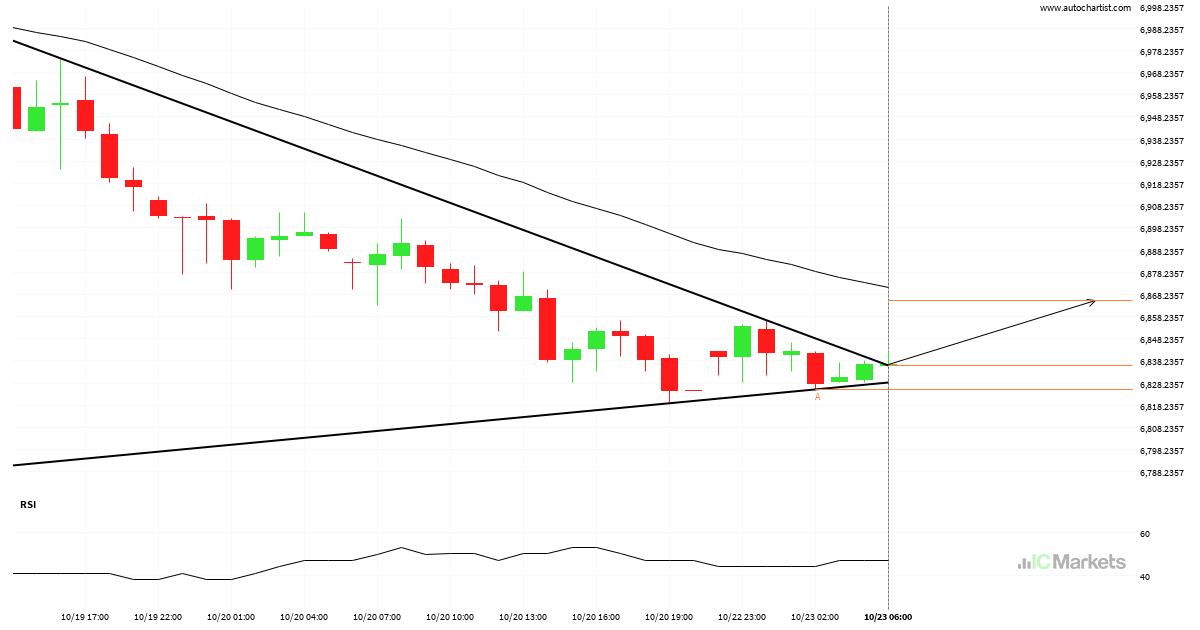
Australia 200 Index has broken through resistance

Australia 200 Index has broken through a resistance line. It has touched this line at least twice in the last 5 days. This breakout may indicate a potential move to 6865.3840 within the next 11 hours. Because we have seen it retrace from this position in the past, one should wait for confirmation of the […]

Read more
October 22, 2023Australian_Stocks_enIC Markets

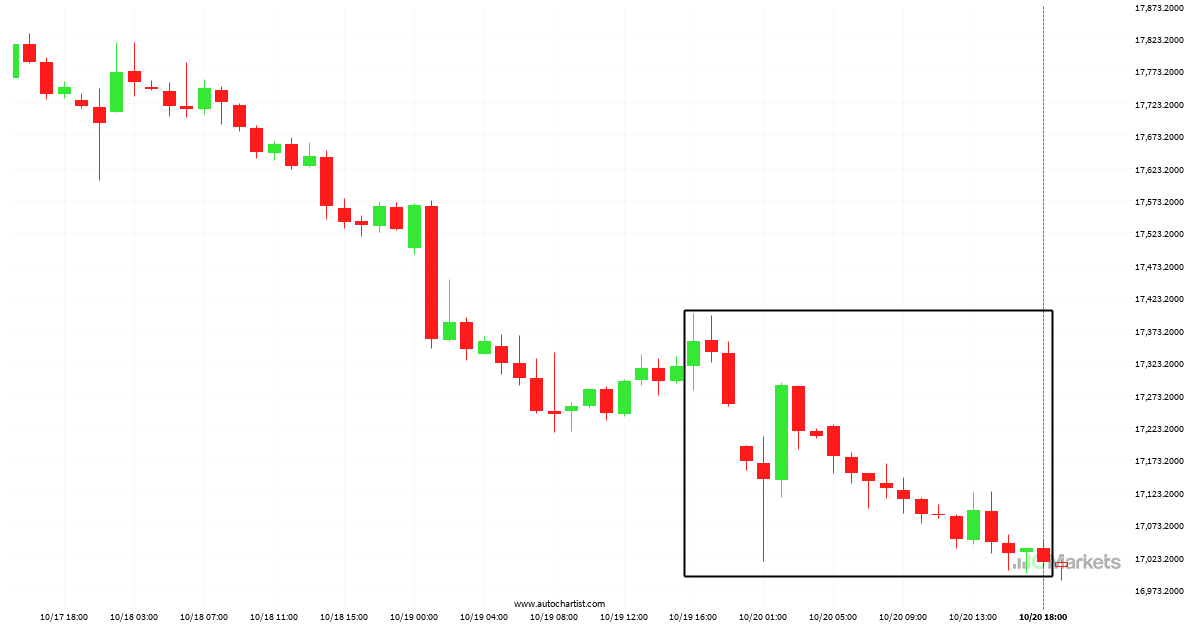
Huge bearish move on Hong Kong 50 Index

Hong Kong 50 Index has moved lower by 1.96% from 17355.5 to 17015.5 in the last 2 days.

Read more
October 19, 2023Australian_Stocks_enIC Markets

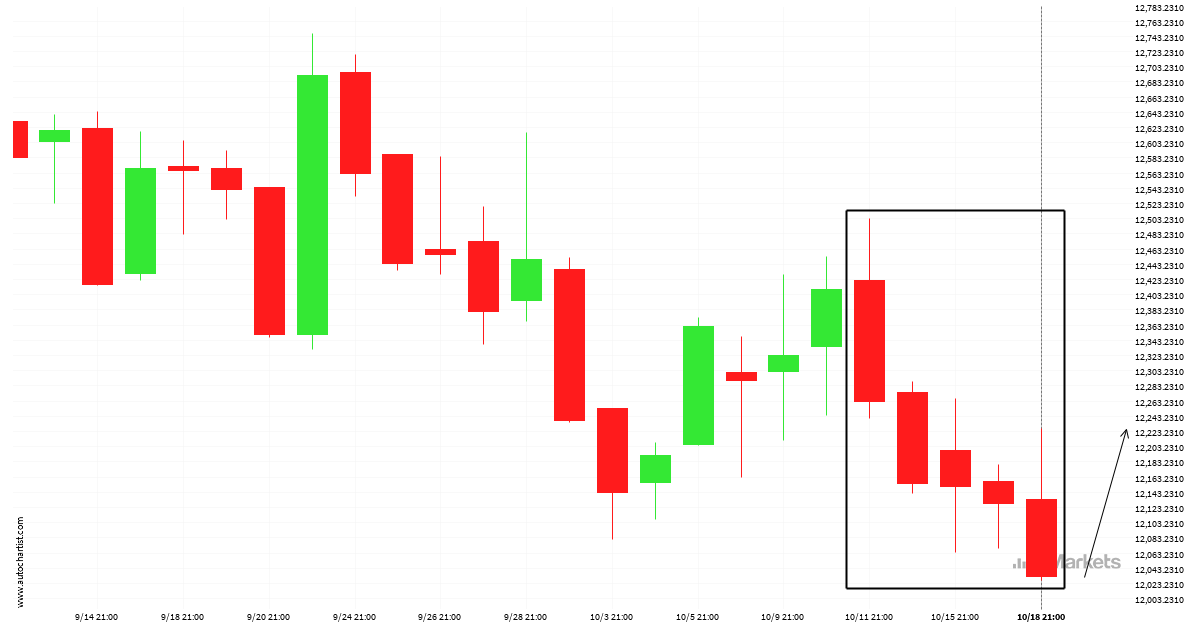
5 consecutive daily bearish candles on FTSE China A50 Index

FTSE China A50 Index has moved lower after 5 consecutive daily candles from 12422.0600 to 12031.0000 in the last 8 days.

Read more
October 18, 2023Australian_Stocks_enIC Markets

Hong Kong 50 Index has broken through support

Hong Kong 50 Index has broken through a support line. It has touched this line at least twice in the last 3 days. This breakout may indicate a potential move to 17473.9014 within the next 8 hours. Because we have seen it retrace from this position in the past, one should wait for confirmation of […]

Read more
October 18, 2023Australian_Stocks_enIC Markets

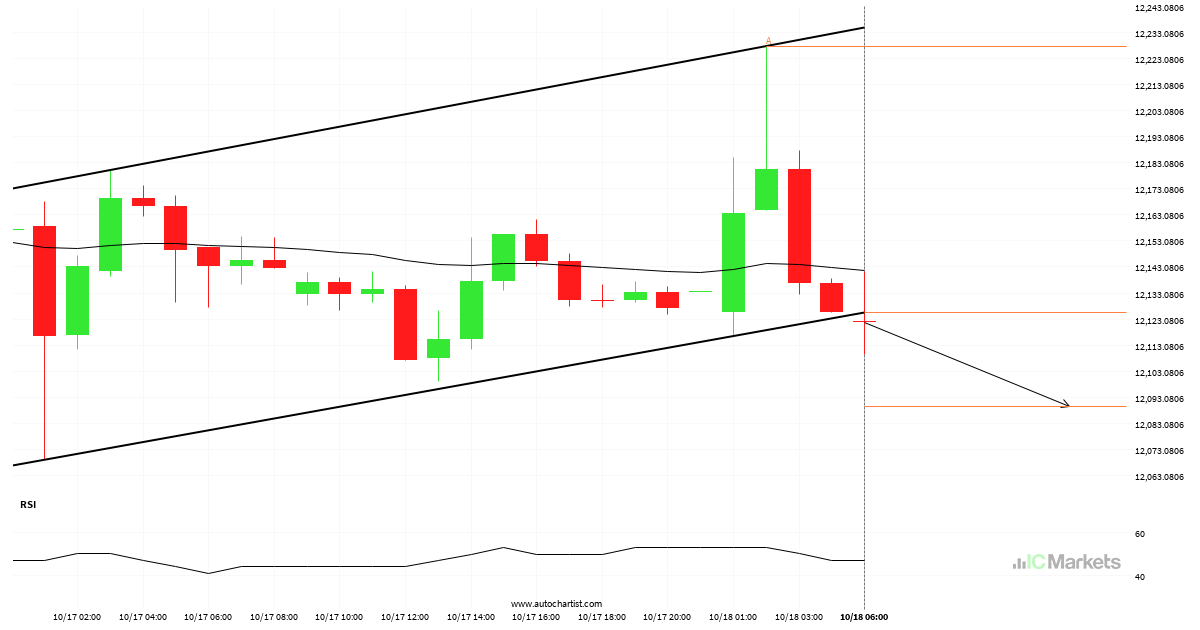
FTSE China A50 Index has broken through support

FTSE China A50 Index has broken through a support line. It has touched this line at least twice in the last 3 days. This breakout may indicate a potential move to 12089.5355 within the next 7 hours. Because we have seen it retrace from this position in the past, one should wait for confirmation of […]

Read more
October 17, 2023Australian_Stocks_enIC Markets

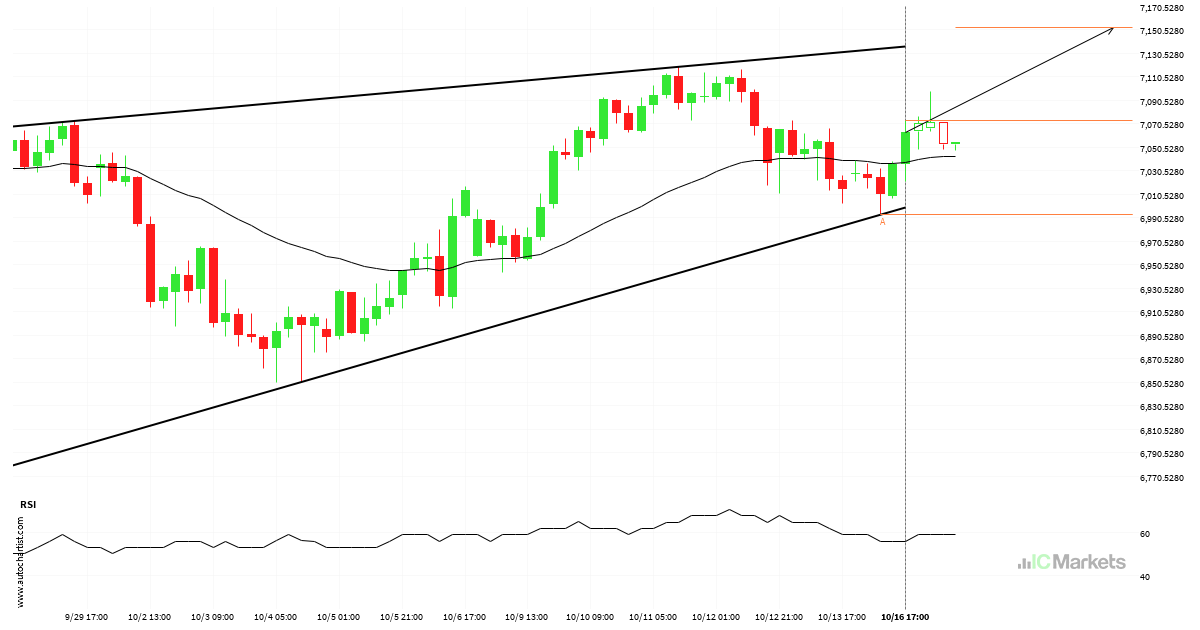
Australia 200 Index approaching resistance of a Rising Wedge

Australia 200 Index is approaching the resistance line of a Rising Wedge. It has touched this line numerous times in the last 22 days. If it tests this line again, it should do so in the next 3 days.

Read more
  • 1
  • 2
  • 3
  • …
  • 26
  • 27
  • 28
  • 29
  • 30
  • 31
  • 32
  • …
  • 153
  • 154
  • 155

Recent Posts

  • Brent Oil vs US Dollar – نموذج الرسم البياني – قناة صاعدة
  • Brent Oil vs US Dollar – نموذج الرسم البياني – قناة صاعدة
  • Hong Kong 50 Index – نموذج الرسم البياني – مثلث صاعد
  • Hong Kong 50 Index – รูปแบบกราฟ – สามเหลี่ยมขาขึ้น
  • Hong Kong 50 Index – نموذج الرسم البياني – مثلث صاعد

Recent Comments

    Translation


     Edit Translation

    Trade with

    a market leader you can rely on

    Open Trading Account Try a Free Demo

    Forex Trading

    • Accounts Overview
    • Open an Account
    • Launch Web Trader

    Trading Specifications

    • Spreads and Commissions
    • Range of Market
    • Trading Hours
    • Funding
    • Withdrawal

    About IC Markets

    • Help Center
    • Why IC Markets
    • Regulation
    • Legal Documents
    • Contact Us


    Forex Trading

    • Accounts Overview
    • Open an Account
    • Launch Web Trader

    Trading Specifications

    • Spreads and Commissions
    • Range of Market
    • Trading Hours
    • Funding
    • Withdrawal

    About IC Markets

    • Chat with a Specialist 24/7
    • Why IC Markets
    • Regulation
    • Legal Documents
    • Contact Us

    Disclaimer: This material is marketing material where all marketing material is published for informational purposes only. This material does not contain and should not be considered as containing - investment advice and recommendations, or suggestions for performing any actions with financial instruments. The built-in widgets belong to their external independent authors, and IC Markets is not responsible for their content and their impact on trade.

    All content rights reserved. Opinions of the authors may not coincide with the opinion of the blog editors. When copying materials from this site or connecting to an RSS feed to republish our articles, a link to IC Markets or attribution in the format ‘IC Markets Blog’ is required. For general questions, please contact the editorial office via the form on the Contact us page.

    Risk Warning: Trading Derivatives carries a high level of risk to your capital and you should only trade with money you can afford to lose. Trading Derivatives may not be suitable for all investors, so please ensure that you fully understand the risks involved and seek independent advice if necessary. A Product Disclosure Statement (PDS) should be considered before entering into a transaction with us.

    The contents of this page are general information only and does not take into account your personal situation, financial objectives or needs. It is up to you to make sure the products that we offer suit your specific needs. You should not trade with us unless you understand the features and risks of the products that we offer. This means that you might need to seek independent advice before you start trading with us.

    © 2022 Raw Trading Ltd | All rights reserved.
    • Sample Page